Stop Guessing Which Clients
Are Actually Profitable.
Custom dashboards that turn your ClickUp data into real-time visibility - so you can see exactly where you're making money, where you're losing it, and how your team's time is actually being spent.
★★★★★ Trusted by 3,100+ agencies running on ClickUp
The Problem
You're running your agency in the dark.
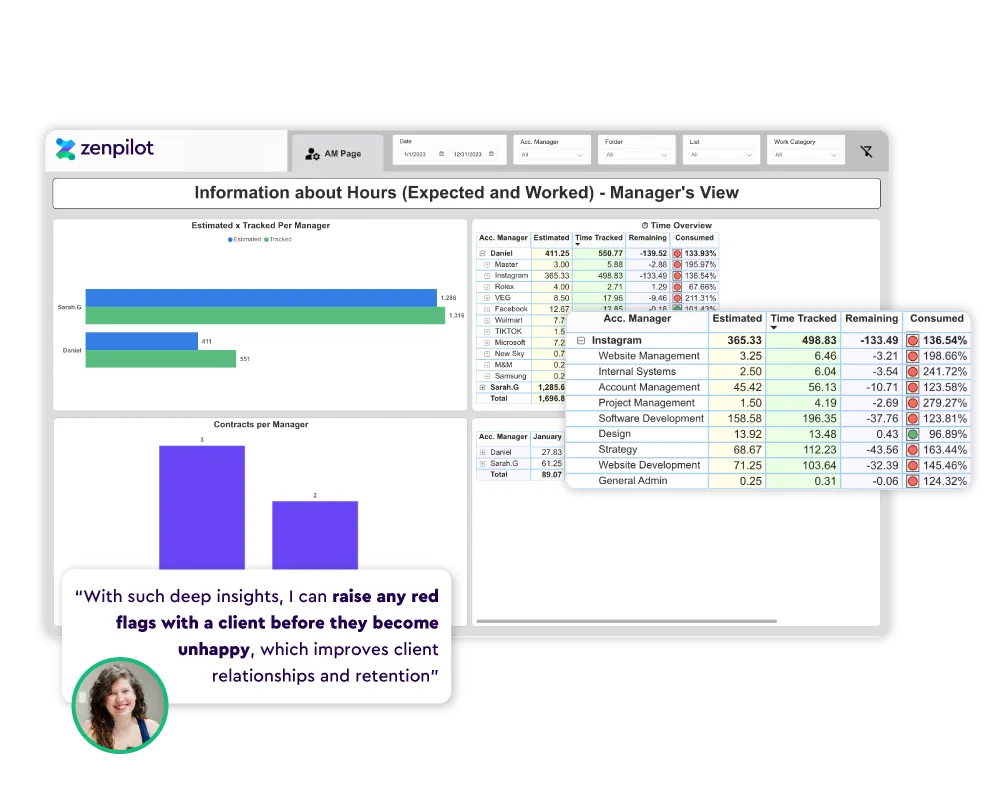
Where is your team spending their time?
You have time tracking turned on, but you still can't tell how weekly hours map to planned work. Billable vs. non-billable is a mystery.
Which clients are actually profitable?
You know some clients take more time than others. But you can't quantify which services, clients, or project types generate the highest margins.
Can your team take on more work?
You're not sure if your team is overworked or underutilized. Hiring decisions are gut calls instead of data-driven choices.
See the reporting in action
Let's walk through the full reporting suite - what's included, how it works, and what your dashboards will look like.
Profitability dashboards built on your ClickUp data
We connect to the data your team already generates in ClickUp and turn it into dashboards that answer the questions keeping you up at night.
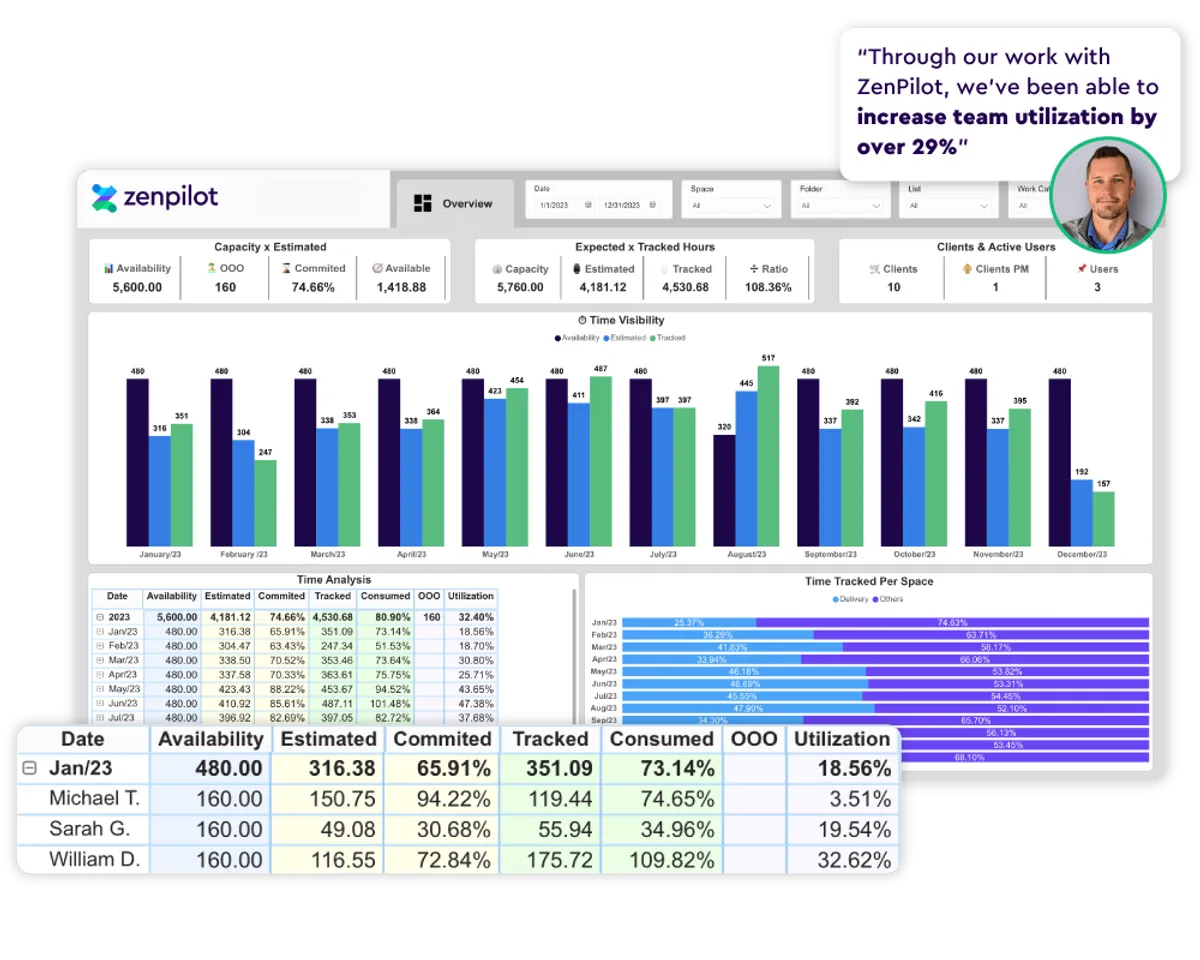
Resource Planning
See exactly how much capacity your team has - factoring in planned time off and holidays. Available hours vs. planned work, utilization rates by team member, and who's overloaded vs. who has bandwidth. All in real time.
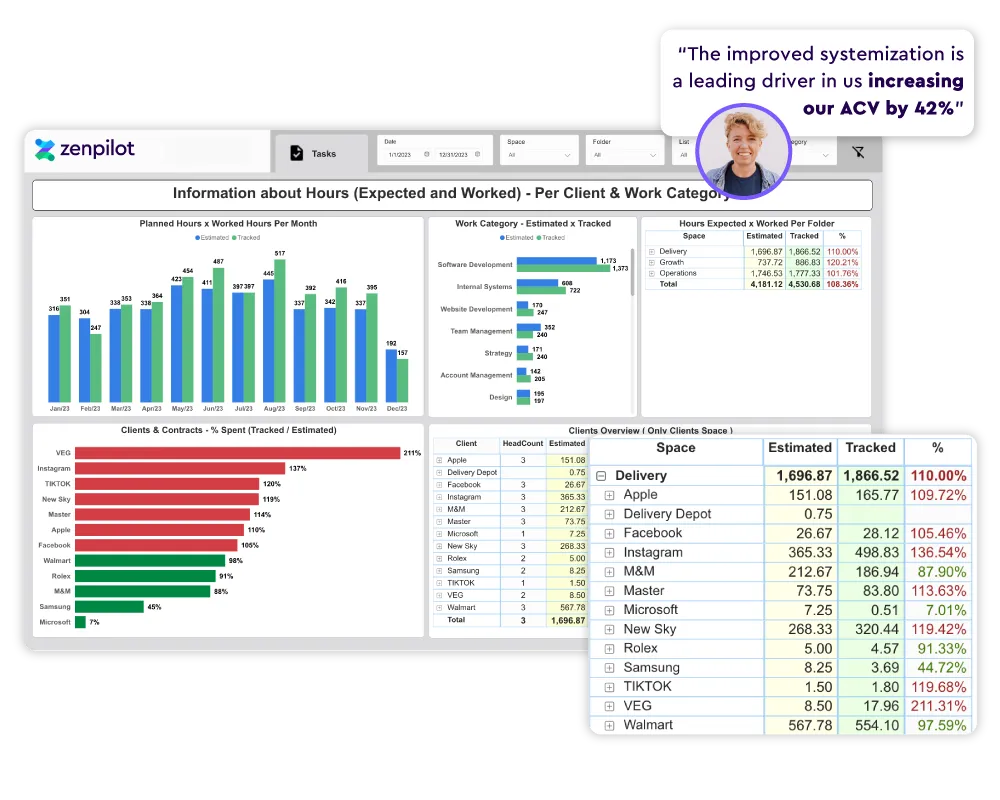
Budget Tracking
See how tracked time compares to estimates and budgets. Catch scope creep before it eats your margins - not after the project ships.
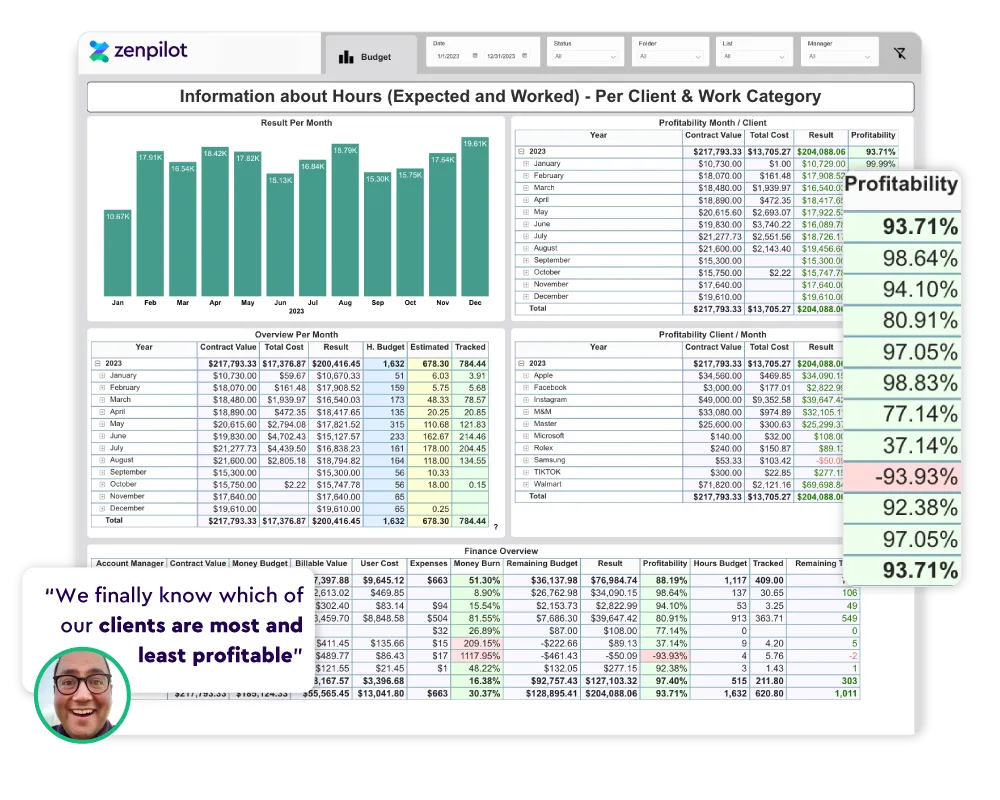
Profitability Analysis
Instant visibility into your financial health. Know exactly where you're profitable and where you're losing money - by client, project, or service line.
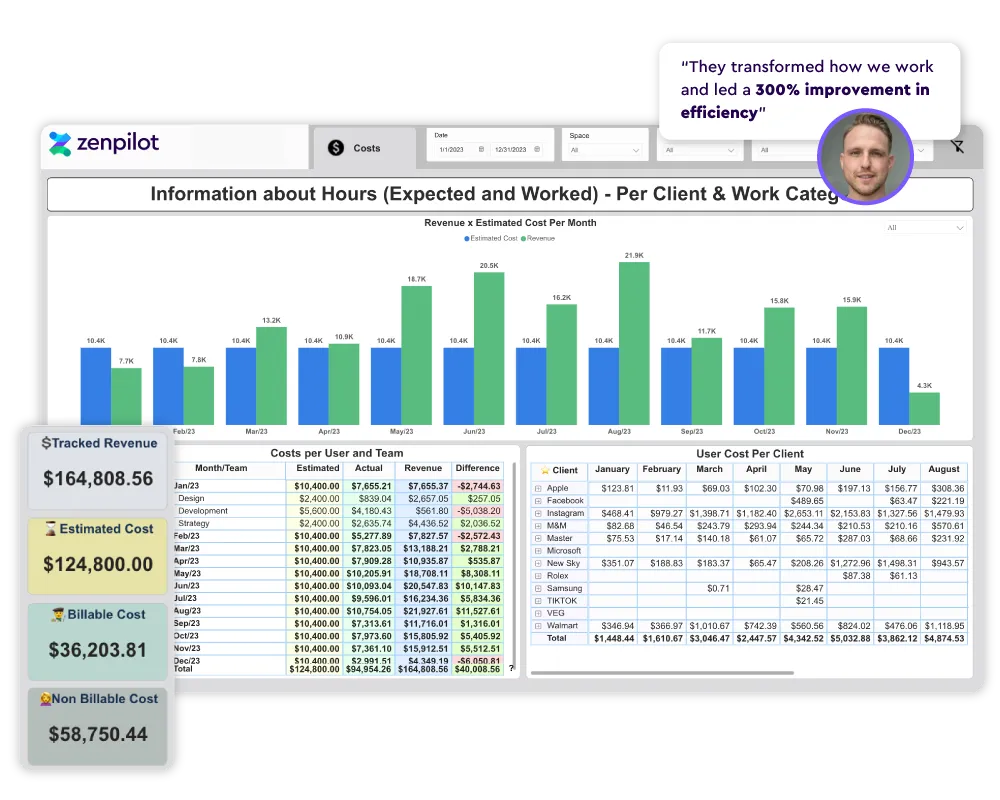
Cost Analysis
Compare team costs against revenue at every level. Identify over-serviced clients, unprofitable project types, and margin erosion before it compounds.
Decision Intelligence
When you have real-time data, you can act before issues become fires. Refine your ideal customer profile, adjust pricing, and grow with confidence.
Three steps to financial clarity
Your team works in ClickUp
Your team closes tasks, tracks time, and builds healthy habits in ClickUp. That's the data foundation everything else is built on.
We build the infrastructure
We create a financial data Space in your ClickUp workspace, build the API to extract and visualize your data, and embed the dashboards right back into ClickUp.
You make better decisions
We train your team to read and act on the reports. You know which clients to grow, which to fire, and when to hire - backed by real numbers.
The real game changer of working with ZenPilot was the visibility it gave us into our whole business. ZenPilot is hands down one of the best investments we've made as a business.
 Rebecca Nash - Director of Operations, Beam Content
 ZenPilot has been the most impactful agency operations investment we've ever made. They led a 300% improvement in efficiency.
 Michael Lisovetsky - Co-Founder, JUICE
 Simple, transparent pricing
Choose annual for the best value, or go month-to-month for flexibility.
Annual Plan
Full reporting suite with the best per-month rate.
- All profitability & utilization dashboards
- Resource planning & capacity views
- Budget tracking & scope creep alerts
- Cost analysis by client, project & service
- Embedded directly in your ClickUp workspace
- Team training on how to read & act on reports
Monthly Plan
Same reporting suite, flexible commitment.
- All profitability & utilization dashboards
- Resource planning & capacity views
- Budget tracking & scope creep alerts
- Cost analysis by client, project & service
- Embedded directly in your ClickUp workspace
- Team training on how to read & act on reports
Both plans include setup, API integration, dashboard build, and team training. Book a call to get started.
Everything you need to run a profitable operation

Company Overview
Bird's-eye view of agency health - revenue, margins, utilization, and capacity in one screen.
Task & Time Analysis
Where is your team's time going? Break down hours by client, project type, task category, and team.
Budget Monitoring
Real-time budget burn tracking. Know when a project is going over scope before it's too late.
Cost & Revenue Analysis
Layer labor costs against revenue to see true profitability at the client and project level.
Account Management
Client health at a glance - retainer utilization, satisfaction signals, and renewal readiness.
Common Questions
Do we need to already be using ClickUp?
Yes. The reporting system pulls data from your ClickUp workspace - specifically time tracking, task statuses, and custom fields. If you're not on ClickUp yet, start with our Blueprint or Accelerator to get set up first.
What ClickUp plan do we need?
You'll need at least the ClickUp Business plan to get the most out of the reporting dashboards. ZenPilot customers get access to a ClickUp discount.
How long does setup take?
Most teams are fully set up within 2–3 weeks. We build the financial data Space in your workspace, connect the API, create and embed the dashboards, and train your team on how to use them.
Does my team need to change how they work?
The main requirement is consistent time tracking in ClickUp. If your team is already tracking time, setup is straightforward. If not, we help you build those habits as part of the onboarding.
Can I combine this with the Blueprint or Accelerator?
Absolutely. Many teams add profitability reporting on top of their Blueprint engagement. The reporting layer works best when your ClickUp workspace is already well-structured - which is exactly what the Blueprint delivers.
What if we already have dashboards in ClickUp?
ClickUp's native dashboards are great for project-level visibility. Our reporting layer goes deeper - connecting time data to financial data via a custom API to show true profitability, cost analysis, and capacity planning that native dashboards can't do on their own.
Know Your Numbers.
Grow Your Margins.
Book a demo and see exactly what your ClickUp data can tell you about your business.